Crime Scene and Concept Maps Diabetes Heart
|
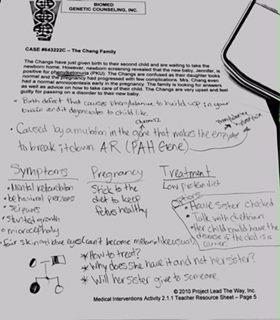
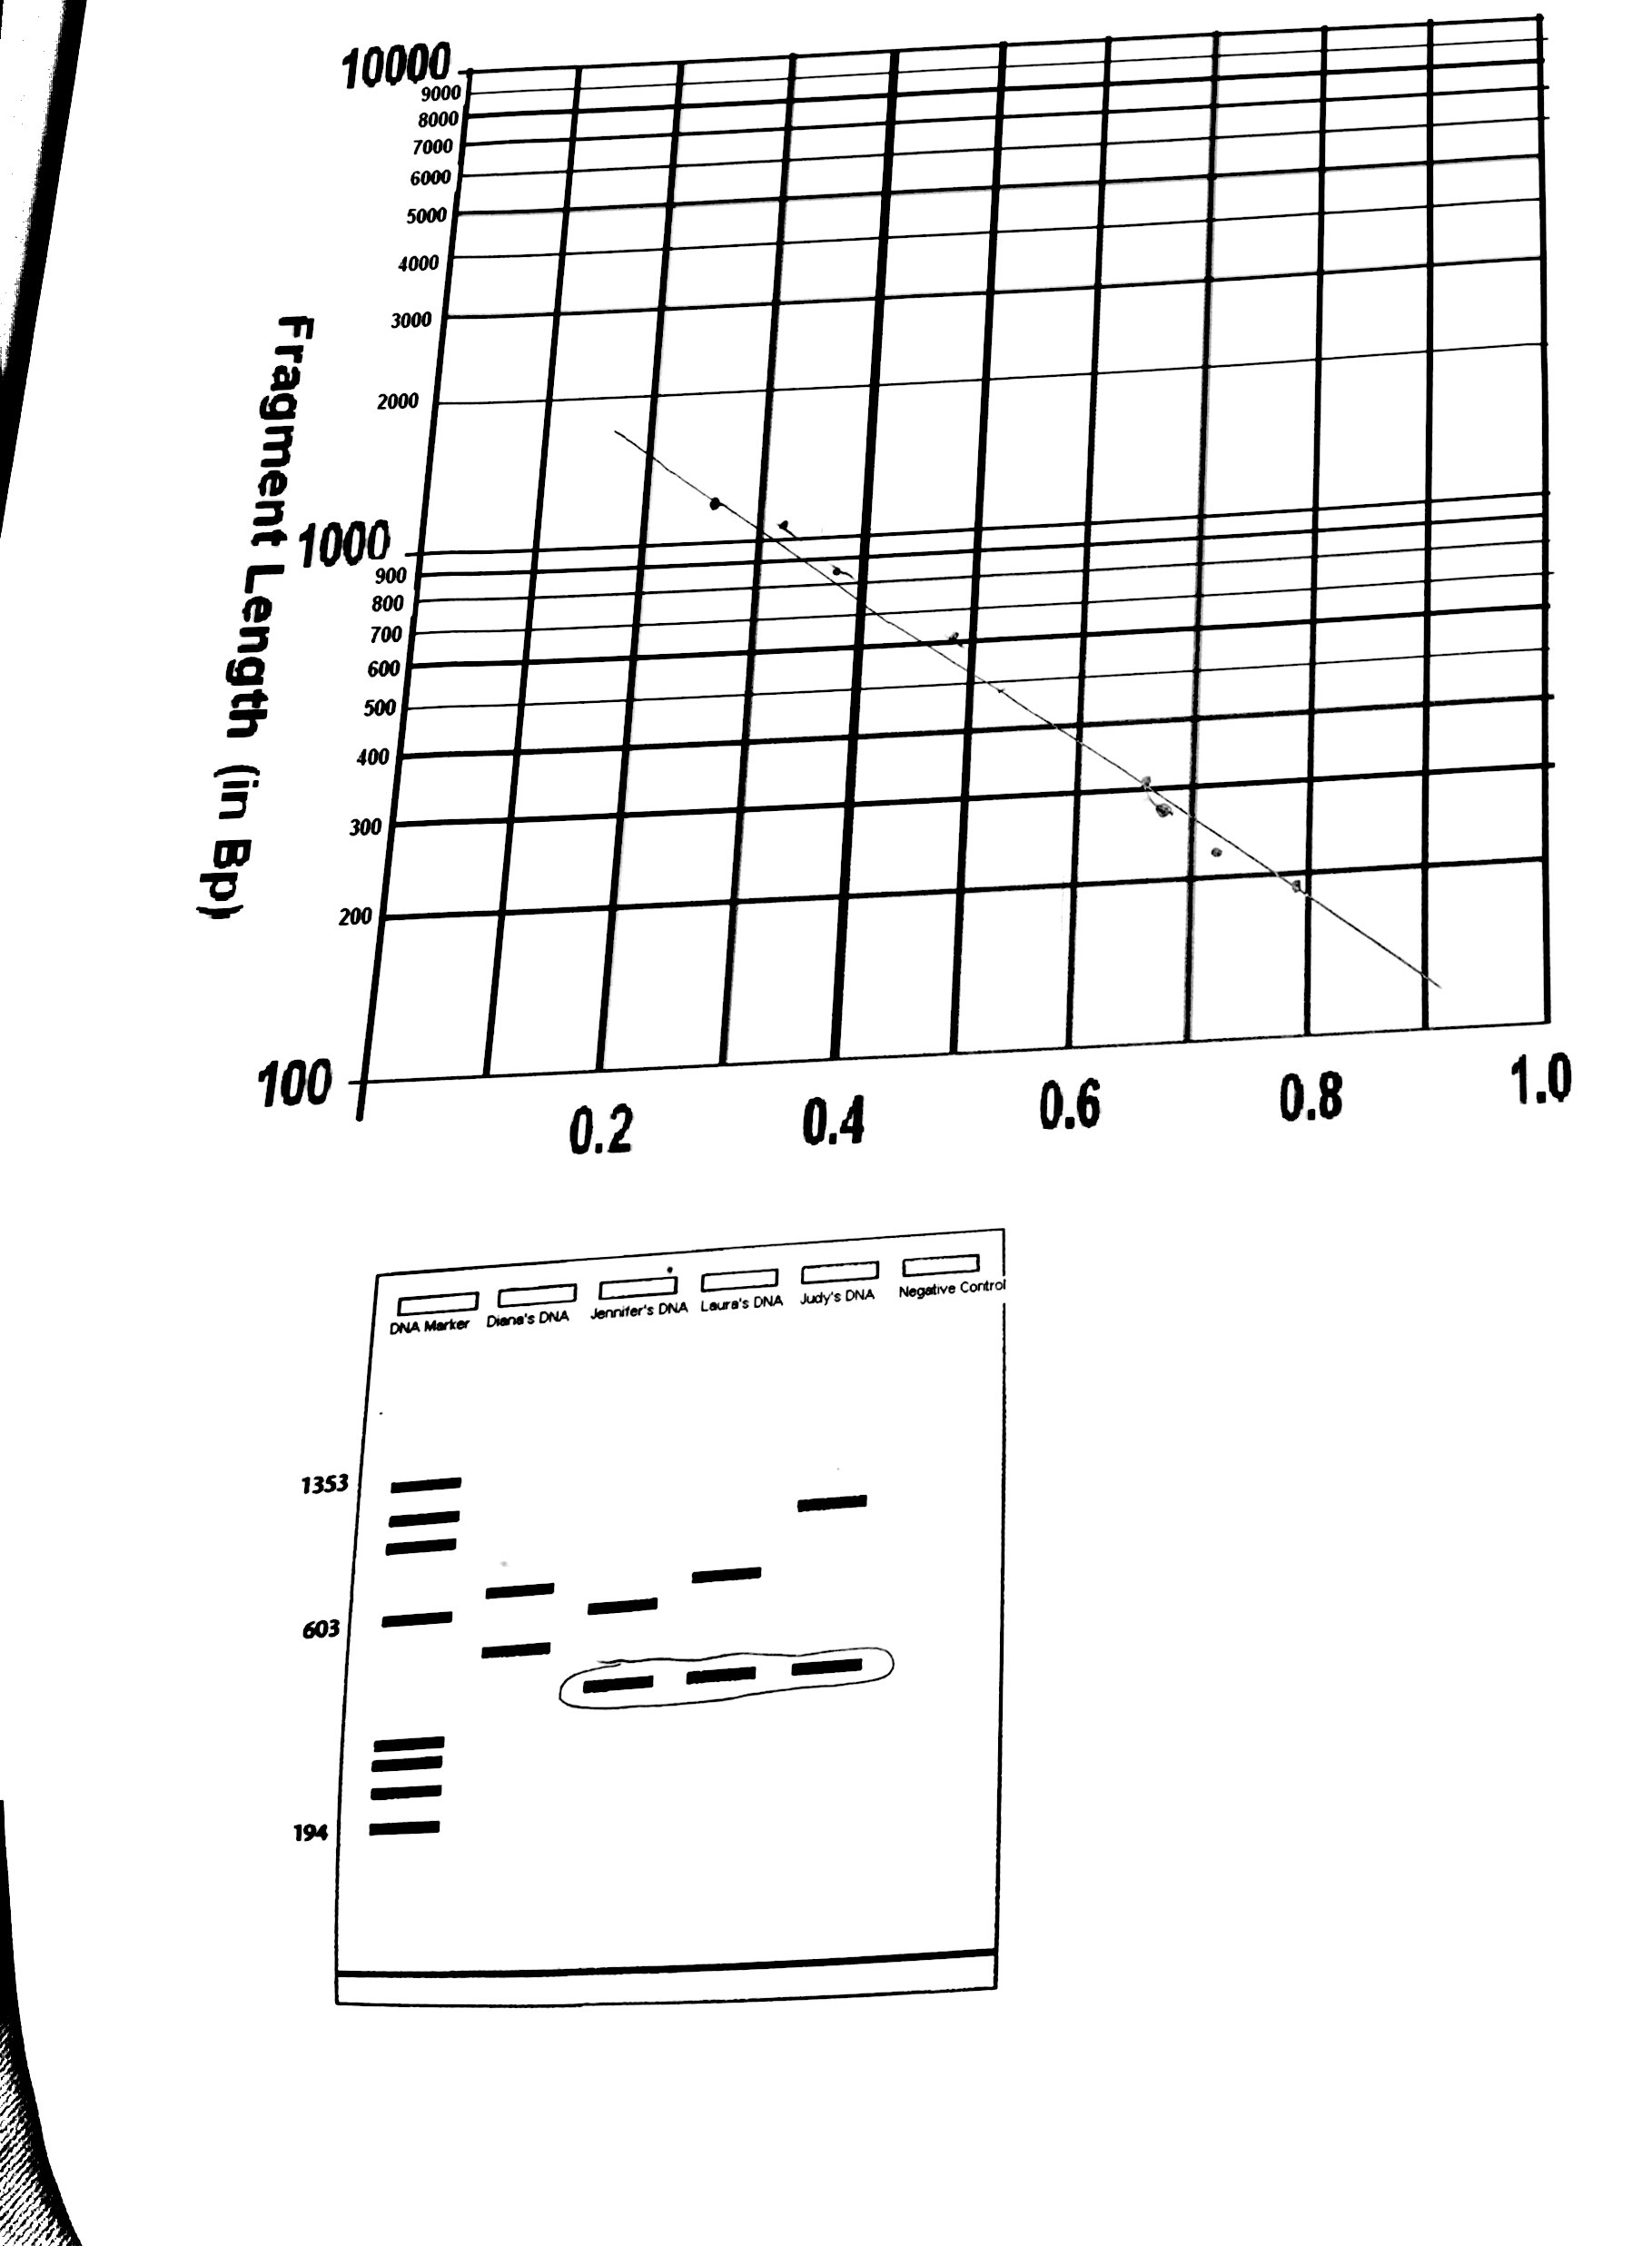
This activity shows a synopsis of how a crime scene has to be analyzed and the aspects found.
The case report explains all of the findings found and the theories of her death.
The experimental design explains how the trajectory of the blood fell and how the exact time of death was calculated.
This concept map shows how feedback loops function, specifically on hormones.
Explains different types of infections and how they're transmitted.
|
The graphs explain relationships between insulin and glucose in the body.
The brochure explains how type 1 effects the body, treatments, lifestyle changes, and various other information.
The powerpoint shows a new innovation created to help treat the effects of diabetes on the body.
The diagram shows the differences and similarities between type 1 and type 2 diabetes.
|
The diagram shows how blood runs through the heart and how it is pumped throughout the body.
The EKG (4.2.3 and 2.2.2.) shows my regular EKG and it also includes a lab report of a normal EKG and an EKG while laying down.
The brochure explains how cholesterol effects the body, the different types, and other aspects of blood.
| ||||||||||||||||||||||||
HBS Activities:
|
The case report explains that the bone findings identified the person as a Caucasian male.
This shows height estimation via various bones used.
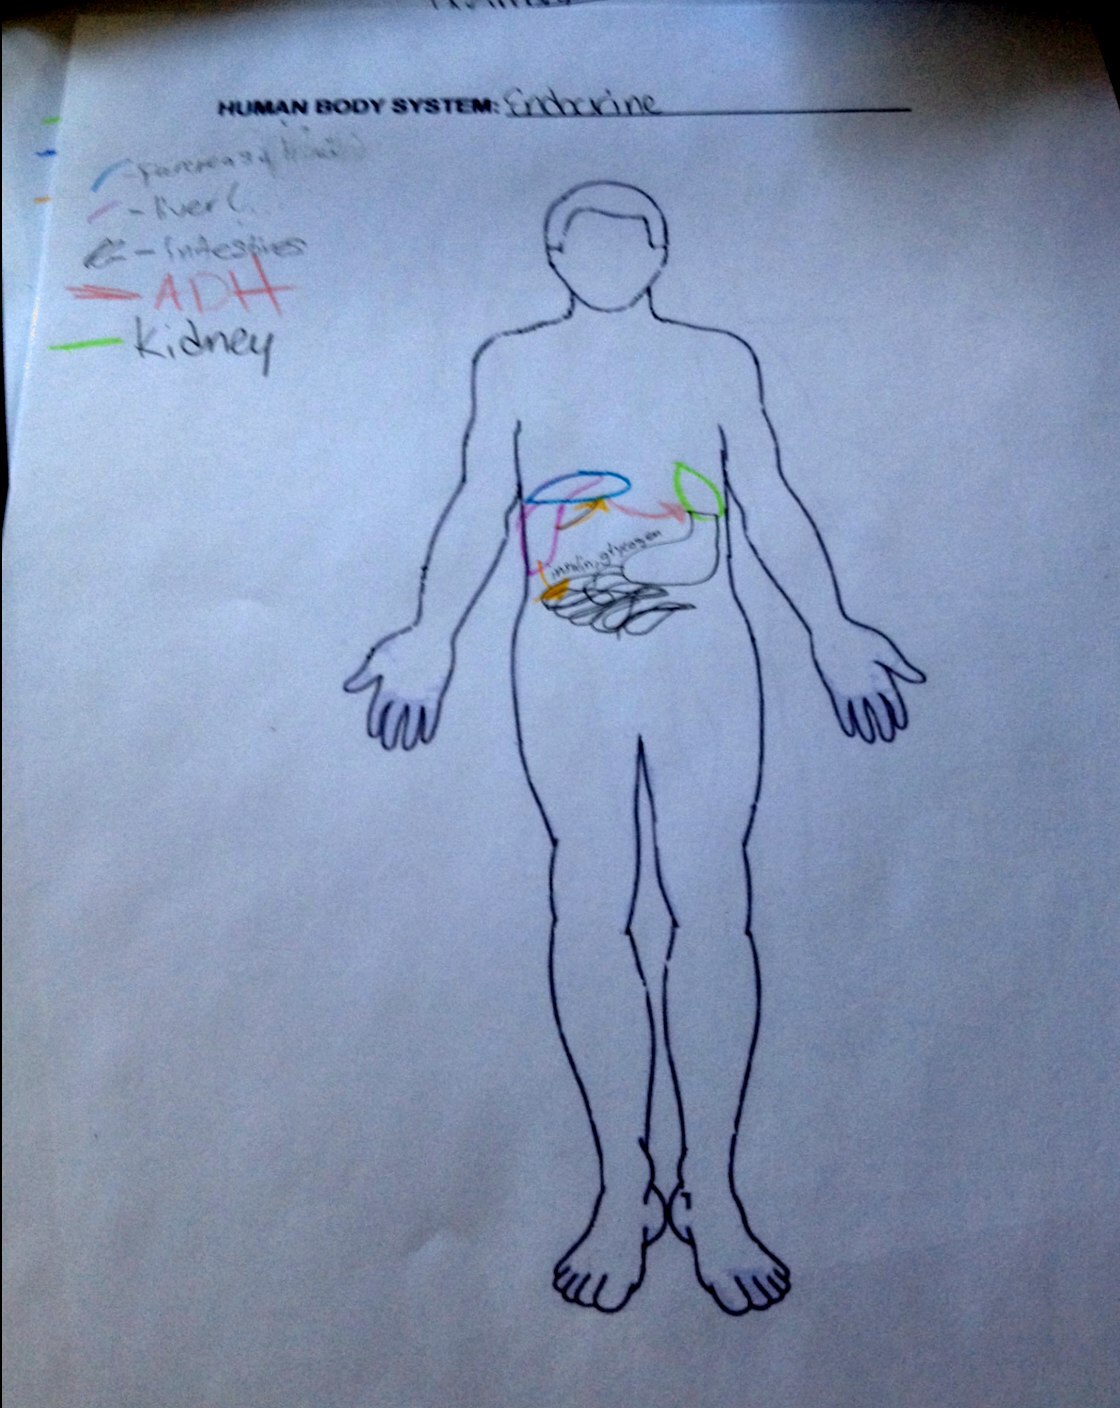
This map shows the relationships and loops that the endocrine system takes to keep the body at homeostasis.
The lab showed the affects of pH on the process of digestion and why optimal pH is between 6-8.
The report showed the differences in reaction time based on different controls.
The concept map shows the relationships between the thyroid and pituitary gland.
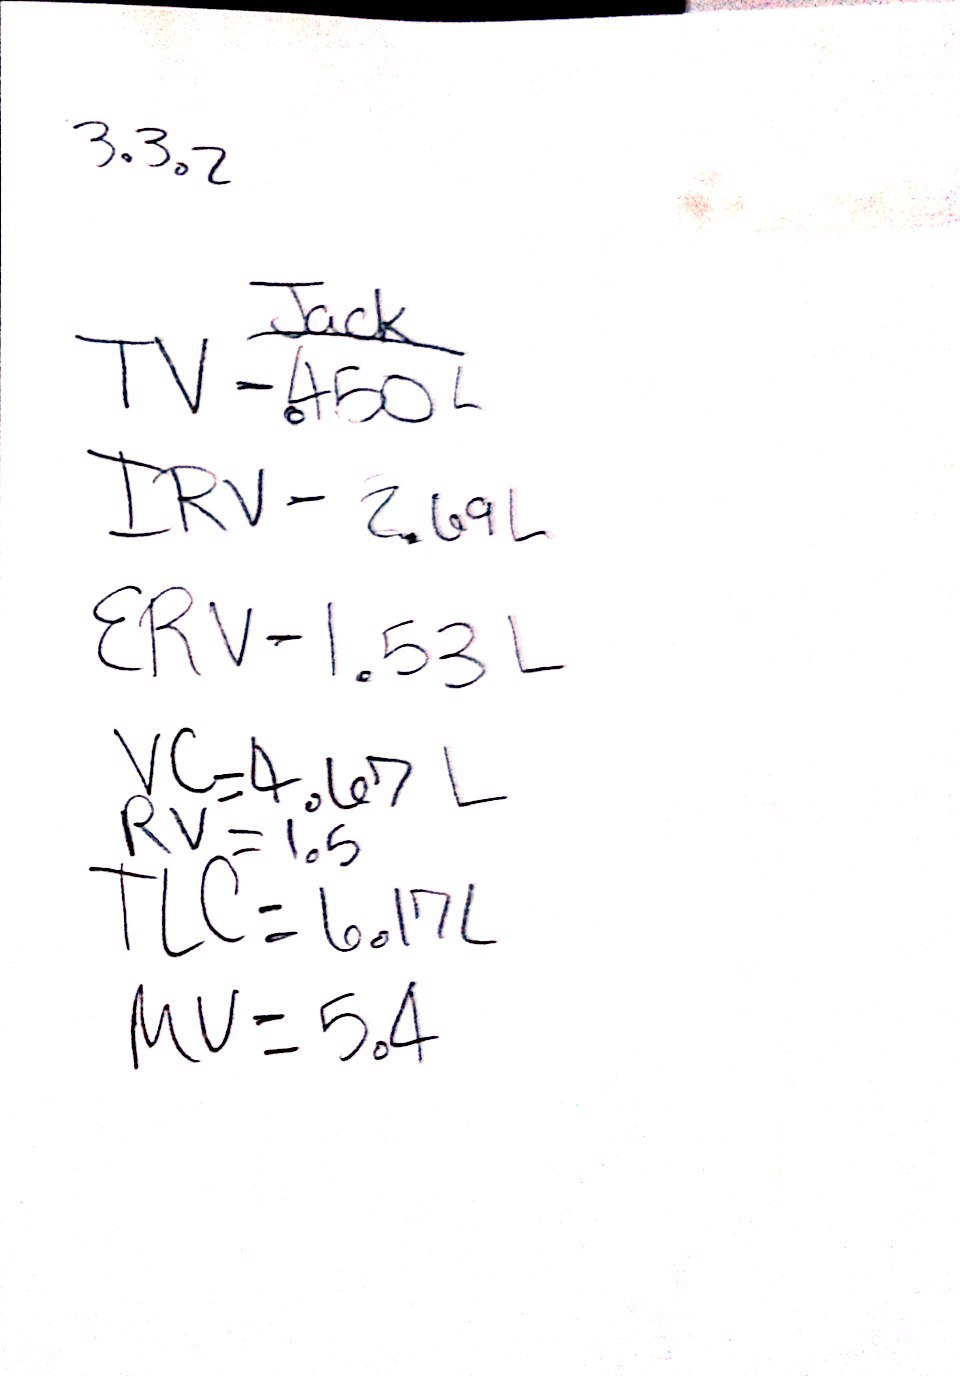
The calculations showed Jacks lung capacities using a spirometer.
|
This was a security system that utilized biometrics in airports.
A powerpoint that demonstrated and explained the various stages of Parkinson's
|
A picture of me after creating the brain cap of body function regulation.
Picture of me with finished maniken.
This picture shows how the nephron works in correlation to each other.
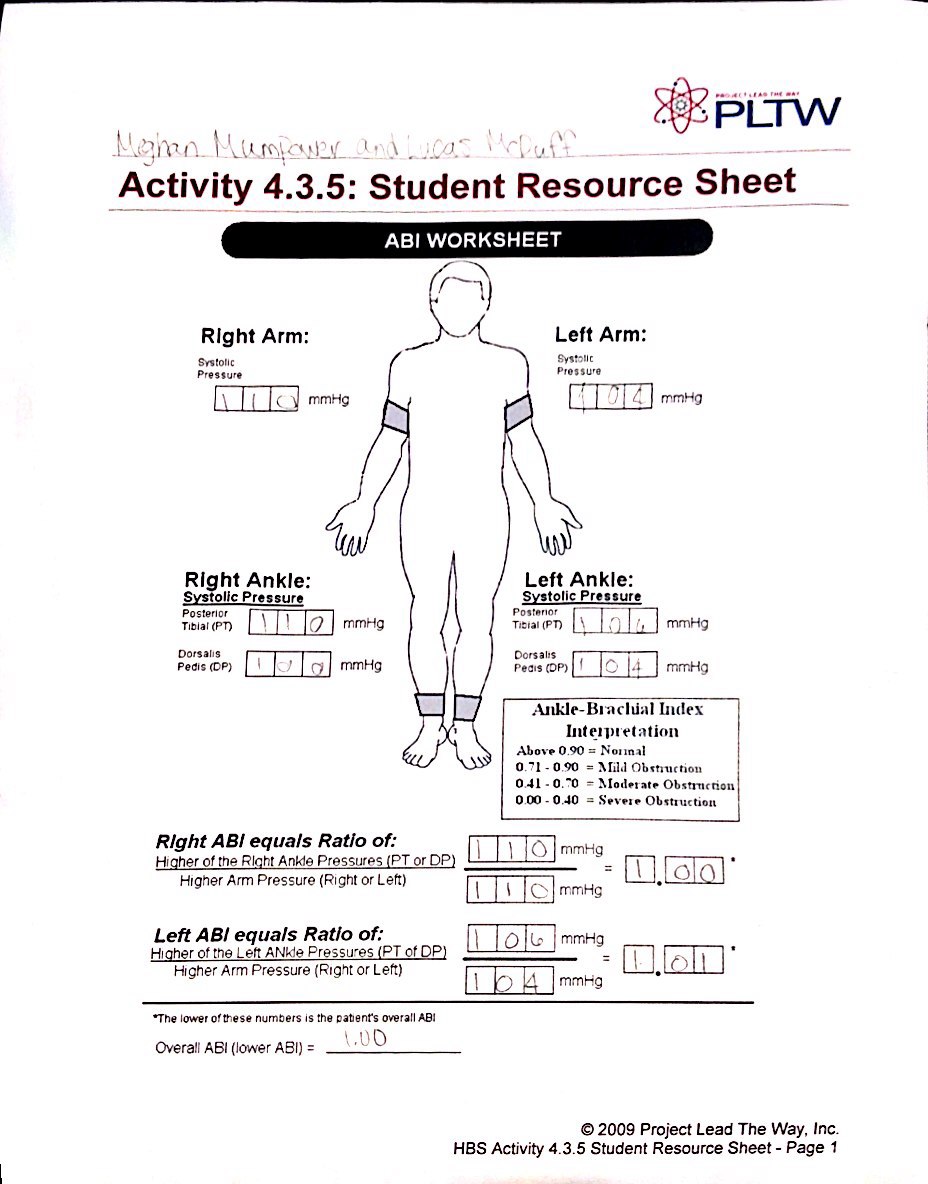
These calculations were taken by using a doppler to determine blood pressure.
A model of how muscle contraction takes place and the elements that contribute.
| ||||||||||||||||||||||||||
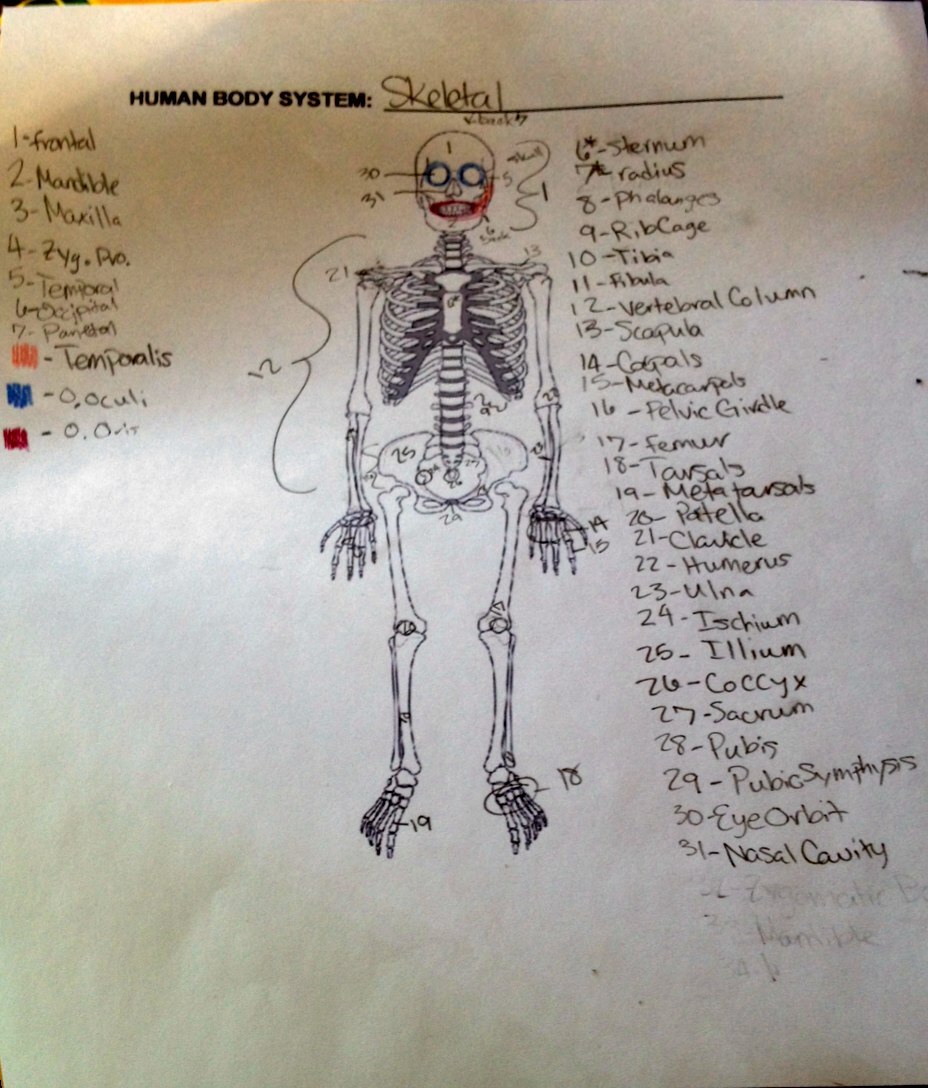
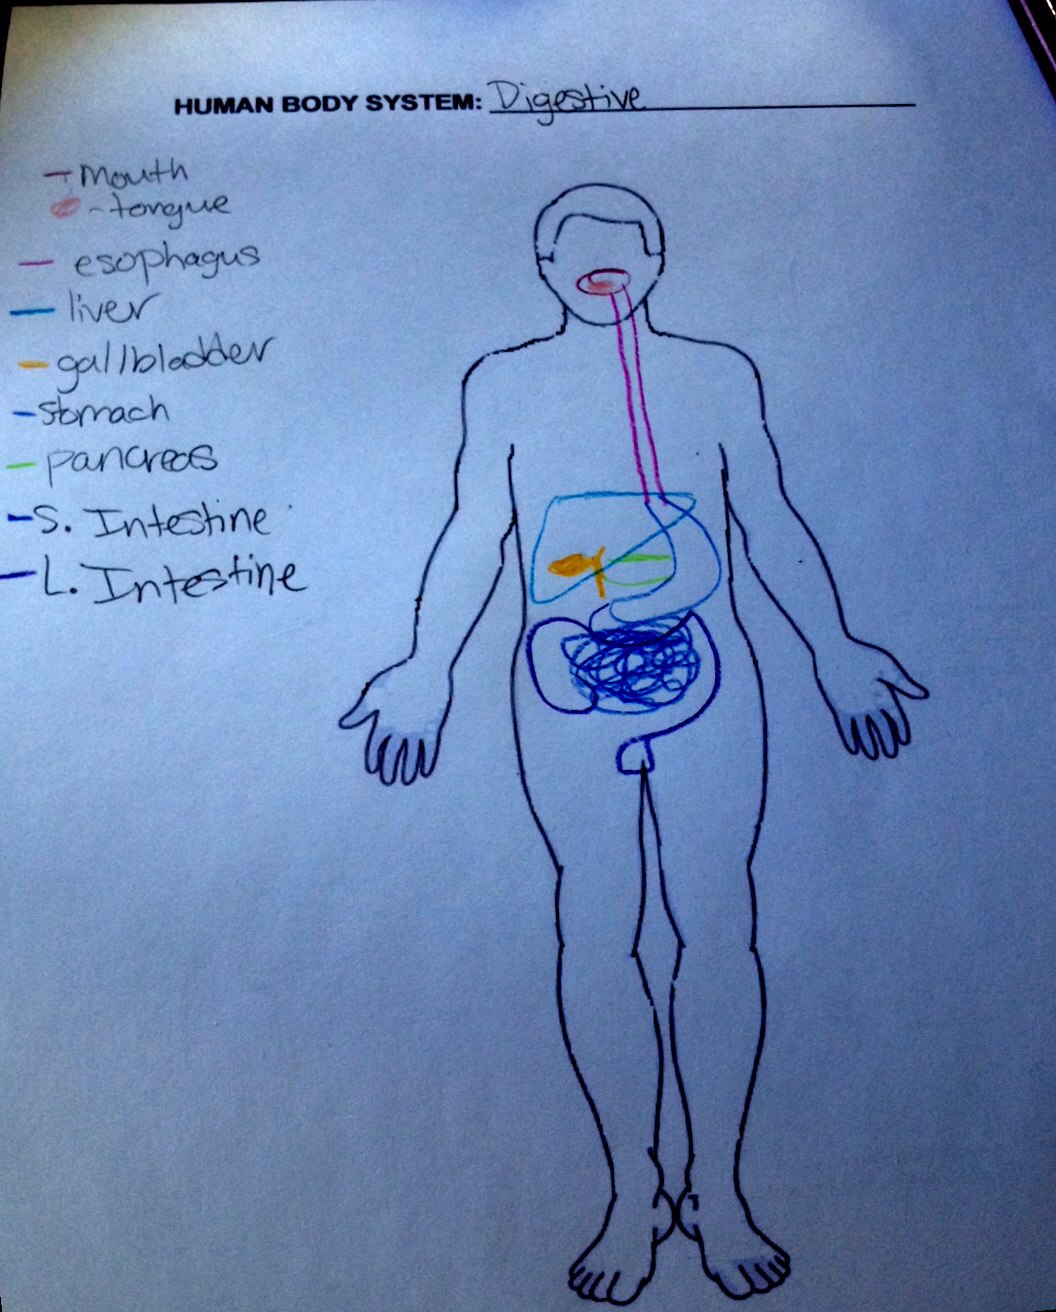
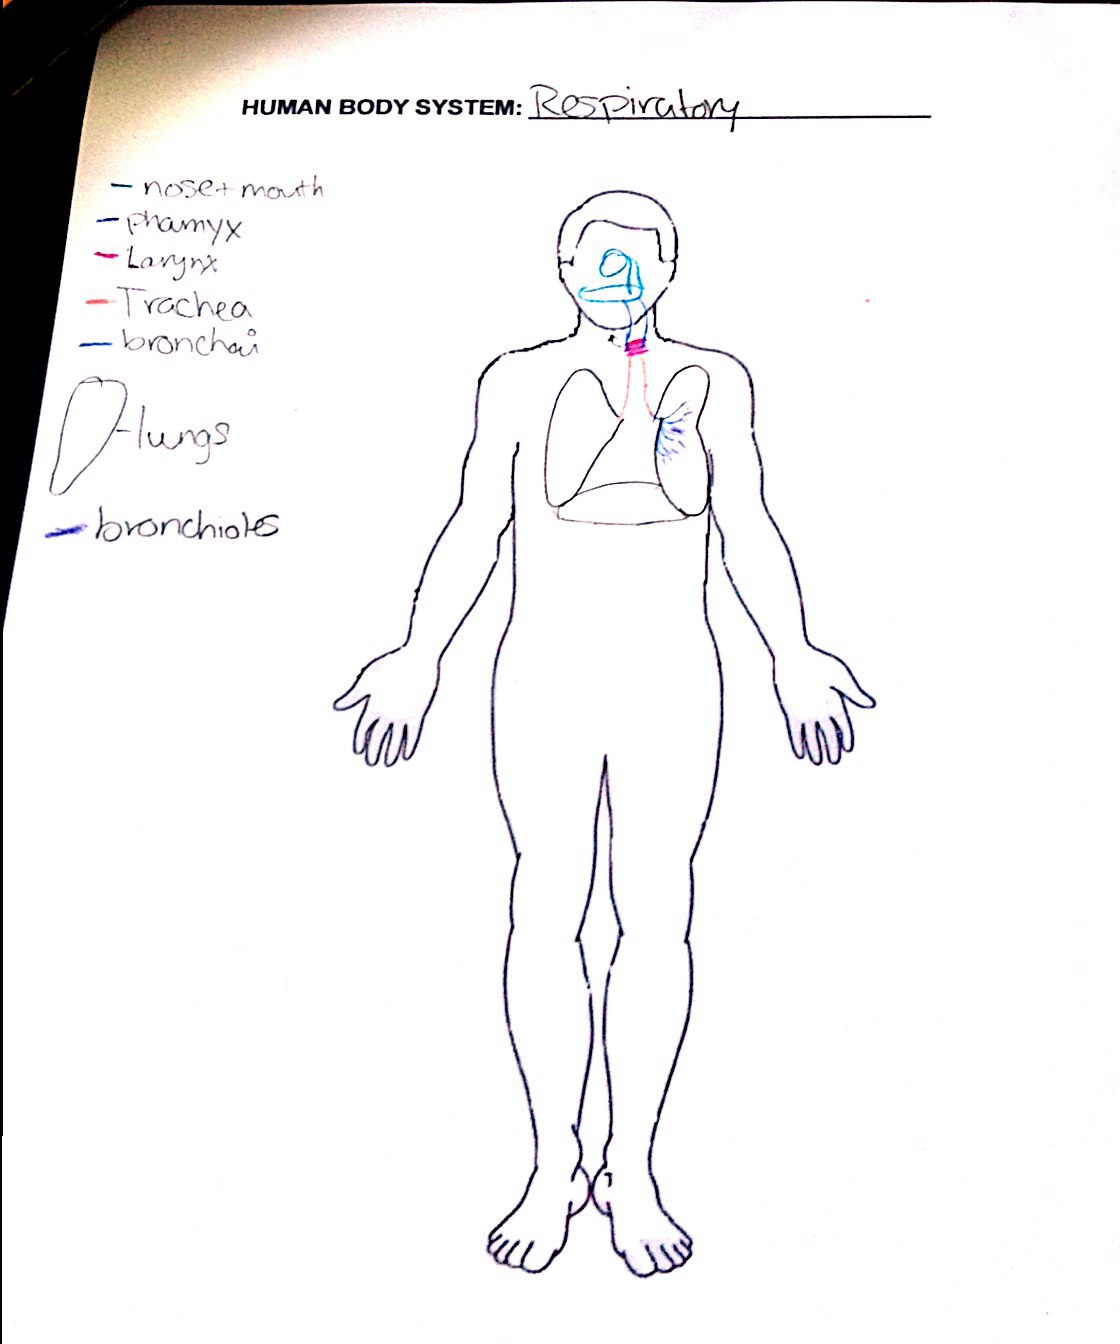
Body System Organizers
| skeletal.jpg |
| digestive.jpg |
| respiratory.jpg |
| endocrine.jpg |
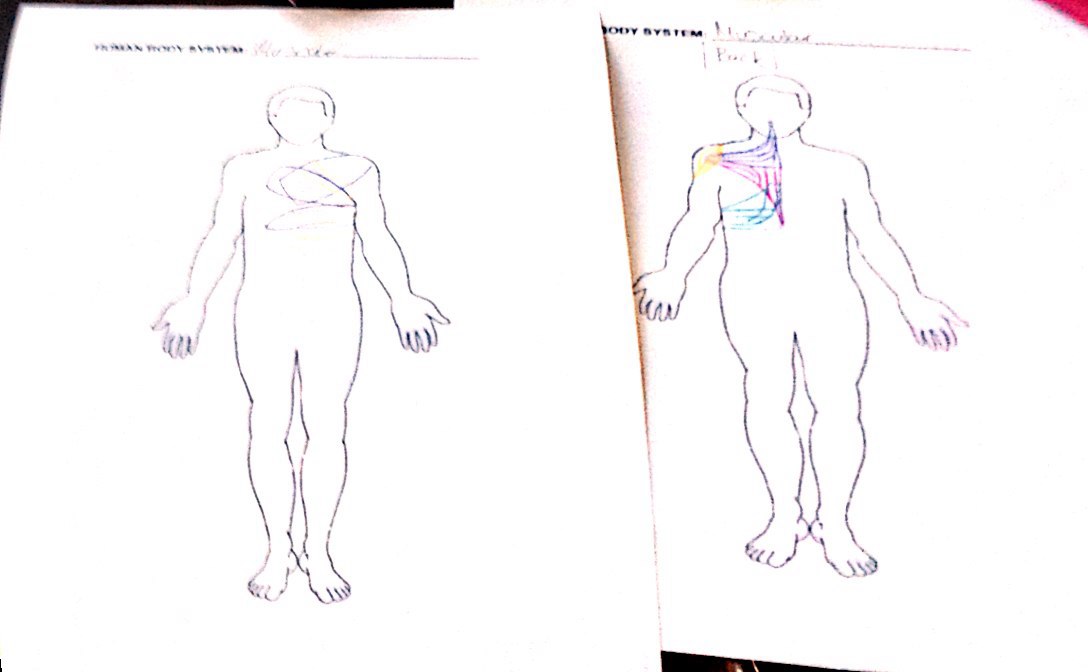
| muscular.jpg |
MI Classroom Activities
|
This is a concept map that shows when, what, and for how long different cancer screenings should happen for women.
These worksheets showed the results and understanding of microarrays.
This lab report shows the effects of UV light on yeast cells when protected vs. unprotected.
This was a clinical trial developed to use nanotechnology for a colon cancer patient.
This paragraph explains the purpose of the jellyfish lab we did in class. This also includes a diabetic timeline.
| ||||||||||||||||||||||||||||||
